General
Q: What is SIGVIEW?
A: SIGVIEW is a complete real-time and offline spectral analysis software with wide range of powerful signal analysis tools, statistics functions and a comprehensive visualization system
A: SIGVIEW is a complete real-time and offline spectral analysis software with wide range of powerful signal analysis tools, statistics functions and a comprehensive visualization system
Q: Are there different Versions/Editions of SIGVIEW?
There are two SIGVIEW versions: STANDARD and PRO. See this page for a detailed list of differences.
Q: How much does it cost, and what do I get for my money?
A: Single license price for SIGVIEW STANDARD is US$ 160.00 for online (download) version and US$ 360.00 for the PRO version. For additional US$ 25.00, you can get a boxed CD version. This price includes a license for the current SIGVIEW major release (v7.x) and all later minor updates (all v7.x versions). All major updates to a next version are also free of charge for one year after purchase. For quantity discounts or special wishes see our online shop or contact us. After purchasing SIGVIEW license, you will get a registration key to unlock the trial version which can be downloaded from this web site. If you need technical support, you can purchase one of our Premium support packages.
A: Single license price for SIGVIEW STANDARD is US$ 160.00 for online (download) version and US$ 360.00 for the PRO version. For additional US$ 25.00, you can get a boxed CD version. This price includes a license for the current SIGVIEW major release (v7.x) and all later minor updates (all v7.x versions). All major updates to a next version are also free of charge for one year after purchase. For quantity discounts or special wishes see our online shop or contact us. After purchasing SIGVIEW license, you will get a registration key to unlock the trial version which can be downloaded from this web site. If you need technical support, you can purchase one of our Premium support packages.
Q: What kind of support do I get?
A: SIGVIEW STANDARD licenses generally do not include technical support for program usage or your specific application. We offer various Premium support packages which provide you direct email contact with our support. SIGVIEW PRO License includes one hour of technical support for each order.
A: SIGVIEW STANDARD licenses generally do not include technical support for program usage or your specific application. We offer various Premium support packages which provide you direct email contact with our support. SIGVIEW PRO License includes one hour of technical support for each order.
Q:Which data acquisition hardware is supported by SIGVIEW?
A: SIGVIEW supports real-time data acquisition from following device types:
- NIDAQ and NIDAQmx compatible DAQ devices from National Instruments® (voltage input, IEPE velocity/force/acceleration)
- All Measurement Computing® DAQ devices (12/16/24-bit voltage input)
- LabJack® U3/U6 and T4/T7/T8 USB/Network DAQ devices
- Some Data Translation® DAQ devices (DT9837 series)
- All MS Windows compatible sound cards (DirectSound and ASIO driver models are supported)
Q: Which file formats are supported in SIGVIEW?
A: WAV, Tab/Comma/Semicolon delimited ASCII files, compressed WAV, MP3, WMA, ASF, Audio Interchange File Format (.AIF, .AIFC, .AIFF), Sun Microsystems and NeXT audio files (.AU,.SND), Raw file formats (8, 16, 32-bit), European Data Format (EDF). We have also developed support for many exotic file types for different customised SIGVIEW versions - you can simply send us an email and ask about the support for your specific file type.
Q: What are minimum hardware and software requirements for SIGVIEW?
A: SIGVIEW works on all 64-bit Microsoft Windows operating systems (Win XP, Vista, Windows 7, Windows 10). Hardware requirements depend highly on your analysis. For simple analysis, any computer capable of running Windows will be enough. For more complex analysis, CPU power and amount of RAM are important. For example, to calculate 16 million samples FFT, you would need at least 1GB RAM.
Q: Does SIGVIEW work on Linux?
A: SIGVIEW is originally developed for MS Windows operating systems, but there is an easy way to make it work on Linux too: You just need to install Wine, an Open Source implementation of the Windows API on top of X-Windows and Unix. Then, simply install SIGVIEW by using its installer. Most SIGVIEW functions will work just like under Windows OS. Loading compressed signal files like MP3, WMA, etc., as well as support for professional A/D cards is not yet included.
Q: Is there a limitation in file size, FFT size or sample rate?
A: Only physical limitations of your RAM, hard disk space and CPU power apply. Please note that SIGVIEW keeps all data in RAM or in a system swap file; therefore, the size of signals should not exceed available RAM size to achieve best performances. All signals are internally stored as 4-byte float values so you can easily calculate the amount of memory needed to store and display the signal. To calculate 16 million samples FFT, you will need at least 1GB RAM.
Q: I find SIGVIEW too difficult to learn. What should I do?
A: Take a look at SIGVIEW examples (under Help/Examples menu option), try reading this FAQ, SIGVIEW help file or take a look at our video tutorials. If you need technical support for SIGVIEW usage, you can purchase one of our Premium support packages.
Usage/Functions
Q: I have a signal I would like to analyze. How do I start?
A: Load it in SIGVIEW by using "File/Load signal" menu option. To take a first look at spectral characteristics of the signal, try "Signal tools/Time-FFT" menu option with default settings. You will get a 3D graphics showing the changes of all signal's frequency components through time.
A: Load it in SIGVIEW by using "File/Load signal" menu option. To take a first look at spectral characteristics of the signal, try "Signal tools/Time-FFT" menu option with default settings. You will get a 3D graphics showing the changes of all signal's frequency components through time.
Q: I would like to analyze recordings from my sound card/DAQ-device in real-time. How do I do it?
A: Try opening one of SIGVIEW examples first (Help/Examples option). You can start with: "Live stereo spectrum with 3D.sws" or "GetFrequency.sws". After loading, simply choose Data acquisition/Start menu option to start monitoring live signal.
A: Try opening one of SIGVIEW examples first (Help/Examples option). You can start with: "Live stereo spectrum with 3D.sws" or "GetFrequency.sws". After loading, simply choose Data acquisition/Start menu option to start monitoring live signal.
Q: How can I exchange data with Microsoft Excel or other applications?
A: To import Excel data in SIGVIEW, save it as "Tab delimited (*.txt)" file from Excel. You should remove all unnecessary headers or additional text from the sheet before you do that. You can import such files in SIGVIEW by using File/ASCII/Import... menu option. To import SIGVIEW data in Excel, save it as tab delimited file by using File/ASCII/Export... menu option, and load those in Excel as Text-file.
A: To import Excel data in SIGVIEW, save it as "Tab delimited (*.txt)" file from Excel. You should remove all unnecessary headers or additional text from the sheet before you do that. You can import such files in SIGVIEW by using File/ASCII/Import... menu option. To import SIGVIEW data in Excel, save it as tab delimited file by using File/ASCII/Export... menu option, and load those in Excel as Text-file.
Q: I would like to explore very low frequencies, under 1Hz. How do I get those in FFT graphics?
A: The lowest frequency of FFT result depends on the sample rate of the signal and the length of a signal segment used for FFT calculation. It will always be equal to SampleRate/SegmentSize. This is not a SIGVIEW limitation, but a mathematical rule for DFT and FFT. For example, if your signal is sampled at 22050Hz, and you perform FFT on its first 512 samples, the lowest frequency will be 22050/512=43.066Hz. If you perform FFT on a 1 second segment from the same signal, the lowest frequency will be 22050/22050=1Hz.
Q: How can I improve the spectral resolution of FFT result? The difference between two adjacent FFT points is 40Hz, and I would like to make it 1-2Hz.
A: The spectral resolution of FFT result depends on the sample rate of the signal and the length of a signal segment used for FFT calculation. It will always be equal to SampleRate/SegmentSize. This is not a SIGVIEW limitation, but a mathematical rule for DFT and FFT. For example, if your signal is sampled at 22050Hz, and you perform FFT on its first 512 samples, the difference between two adjacent FFT points will be 22050/512=43.066Hz. If you perform FFT on 1 sec segment from the same signal, the resolution will be 22050/22050=1Hz.
Q: There is only one FFT button - how can I get power spectrum, PSD, etc.?
A: All spectral analysis tools in SIGVIEW are integrated under FFT option. By default, this option will calculate and display standard Magnitude (Amplitude) FFT plot. If you open Properties dialog for the FFT window, you will be able to change all calculation parameters and to define what will exactly be the result of the calculation: Magnitude, Power spectrum, PSD,... You can change default settings by using Signal tools/Spectral analysis defaults menu option.
Q: I would just like to determine peak frequency of the signal - what are all these FFT parameters?
A: By default, SIGVIEW will calculate spectrum values with optimal parameters - you don't have to bother with complicated things. Just load your signal, press FFT button and then choose Signal tools/Instruments and markers/Maximum position menu option, and an instrument with wanted result will appear along with the marker in the FFT graphics.
Q: Can SIGVIEW display signals or FFT results as overlay graphics?
A: Yes, you can create overlay graphics by using context menus of each signal window, or by using Control window's context menu (select target signals first).
Q: Can I display spectrum on logarithmic X-Axis or Y-Axis?
A: Yes, you can open Axes settings for a FFT window (Edit/Axes settings menu option) and select "Logarithmic X-Axis" and/or "Logarithmic Y-Axis" option. There are also corresponding context-menu options available after mouse right-click on the window.
Q: Can I display spectrum graphics with Y-axis values in dB?
A: Yes, you can set spectrum values to be in dB (logarithmic axis) in Spectral analysis defaults or in properties for each FFT window.
Q: I would like to compare two signals - how can I do it with SIGVIEW?
A: You can compare signals in time domain by showing them as overlays in one coordinate system (context menus or from Control window) or by subtracting them to determine the difference (Signal tools/Signal calculator). To compare signals in frequency domain, you can calculate their FFTs and compare them, or you can use some of cross spectral functions available through Signal calculator. For example, coherence function will show you similarities between signals for each frequency component on 0...1 scale.
Q: Can SIGVIEW trigger some external event in case of a specific analysis result?
A: Yes, you can use "Trigger external application" option of SIGVIEW Instrument windows. These windows can measure different values from the signal and call external applications in case the measured value is in some defined range. As an example, SIGVIEW distribution includes application "Logger.exe" which can be used to simply log instrument values in a log file. Help file describes the requirements for such applications.
Q: How do I set default parameters for spectral analysis calculations?
A: Use Signal tools/Spectral analysis defaults menu option. After you set your preferences there, all new FFT calculations will use these settings.
Q: How can I set marker in a signal?
A: Markers in SIGVIEW are closely related with Instruments. Most Instrument can place corresponding marker in a signal. For example, if you use Maximum instrument to show you the maximal signal value, marker will be displayed on the signal graph maximal value location. You can turn marker on/off or set its parameters by editing instrument properties. If you want simply to set marker on some specific location in the signal, please use "Marker at..." instrument or "Place marker here" option from the signal's context menu.
Q: I performed FFT, but the Y-axis is not labeled. Which units are on Y-axis?
Since spectral analysis is used in many different fields, acoustics, vibration analysis, electronics, etc. , there are also many interpretations and units used for Y-axis values. SIGVIEW should be useful for spectral analysis in all of these application fields and therefore are the units simply omitted. Each user can define own units by using Axes settings for the FFT window.
Q: Can I show X axis in RPM instead of Hz?
A: Yes, you can select corresponding option on spectral analysis defaults or on Properties dialog for each FFT window.
Q: How can I print SIGVIEW graphics?
A: SIGVIEW does not directly offers printing services, because there are simply much better applications for this purpose. You can simply use "Edit/Copy picture to clipboard" menu option to transfer the bitmap of the active window to the clipboard. After you do that, you can open any other graphics-capable application (MS Word, Excel, Visio, MS Paint) and paste the picture there. That way you can integrate SIGVIEW graphics with the rest of your text or you can edit graphics and print everything when you are finished.
Q: How can I save my work?
A: By using options in File menu: "Save workspace..." and "Load Workspace...", you can save all currently opened SIGVIEW windows (workspace) in a file and load it later. SIGVIEW does not save the actual content of every signal - it saves only a structure of your analysis system and file names of loaded files. For example, if you load a signal, perform an FFT on it and save that workspace, SIGVIEW will not save the actual values from the signal or values from the FFT. Only the name of the signal file will be saved along with information that you performed an FFT on it with certain parameters. Therefore, if you change the data in original signal file and reload SIGVIEW workspace, you will get changed signal data and the FFT from it. Generally, workspace file contains the information you see in Control Window plus properties for each window including axes properties and zoom info.
Troubleshooting
Q: After entering my registration data into the registration dialog, SIGVIEW still reports that it is running in Trial mode. What could be the problem?
A: The most common problem is that you did not enter the data exactly as stated in the registration email. All three strings: registration name, email address and registration key must be identical as in the registration email. If this does not solve the problem, just contact us and we will find the solution.
Q: When I play a sound, there are strange periodic crackling noises. What can I do about it?
A: If you select a small part of the signal and then try to play it, SIGVIEW will slide along the signal sending each small segment to the sound card. This is done to synchronize the analysis with the signal playback. The problem is that some sound cards have problems with receiving small data segments to playback (for example less than 128 samples). Similar problems are possible if your computer is too slow, or your analysis system takes too much time to calculate after each signal block is recorded. As a workaround, increase the visible signal segment size.
Q: I can not load my signal file. Why?
A: If your file type is on the supported file list, maybe you do not have the codec needed to open that file type (possible for MP3, WMA, etc.). To solve this, simply install the latest version of Microsoft MediaPlayer. It probably includes all codecs you need. Also, there are various independent codec packs on the internet which could contain the codec you need.
A: If your file type is on the supported file list, maybe you do not have the codec needed to open that file type (possible for MP3, WMA, etc.). To solve this, simply install the latest version of Microsoft MediaPlayer. It probably includes all codecs you need. Also, there are various independent codec packs on the internet which could contain the codec you need.
Q: How to fix error: "Count must be integer multiple of packet size for continuous mode" when performing data acquisition from Measurement Computing USB devices?
A: Some devices have restrictions regarding the "Block size" parameter in data acquisition window. It has to be a integer multiple of internal device packet size. For 1208LS and MiniLAB 1008, this packet size is 64, for 1208FS and 1608FS is 31, for 1616FS is 62 etc. You can find the exact value for your device in Universal Library Online Help.
Q: I saved my signal as WAV file, but it looks empty when loaded back into SIGVIEW?
A: Standard WAV format stores only integer values (usually 8 or 16-bit). When you save to WAV from SIGVIEW, all samples will be rounded to the nearest integer value. Therefore, if your signal values are, for example, between 0 and 0.5, SIGVIEW will round all values to 0 and save those to the WAV file. You can avoid this by saving in a 32-bit float WAV format.
Q: When you start SIGVIEW you get the following error message: "The program can't start because api-ms-win-crt-runtime-l1-1-0.dll is missing from your computer" (or similar)
A: It seems that some of Windows updates from Microsoft required to install SIGVIEW are not available on this computer. You can install the required update KB2999226 directly from here: https://support.microsoft.com/en-us/kb/2999226. Alternatively, you can simply run Windows Update on your computer and let it install all updates. You will have to uninstall/install Sigview after installing the updates.
If this does not work, it could be that your Windows Update is not working properly. In that case, you could try this link from Microsoft to install "Windows 7 Update stuck on Checking for updates..." fix.
Q: On High-DPI displays (for example 4K display on a laptop), SIGVIEW user interface elements are too small
A: You can change the default appearance on High-DPI displays in the Applications Settings dialog (File/Settings menu) by selecting "Adjust automatically" option.
Please note that turning this option on can cause toolbar icons and some other control elements to appear blurry on some High-DPI displays.
Q: On High-DPI displays (for example 4K display on a laptop), SIGVIEW user interface looks blurred
A: You can change the default appearance on High-DPI displays in the Applications Settings dialog (File/Settings menu) by selecting "No adjustments" option.
Please note that turning this option on can cause toolbar icons and some other control elements to appear very small on some High-DPI displays.
Customization
Q: I would like to automate SIGVIEW to perform complex analysis procedures. How can I do it?
A: SIGVIEW can easily be automated to perform complex analysis procedures by using its command-line capabilities. It works just as a kind of remote control API, but does not require programming know-how. See online user manual for details.
Q: Could you make SIGVIEW read my file format or record data from my device?
A: Yes, it is possible. If you can provide the device or example files you would like SIGVIEW to support, and if this support can be important for other users, then this customization can even be free of charge. If not, we will make you a reasonable offer for the requested customization.
A: Yes, it is possible. If you can provide the device or example files you would like SIGVIEW to support, and if this support can be important for other users, then this customization can even be free of charge. If not, we will make you a reasonable offer for the requested customization.
By using Julia scripting function, you can also add the support for your data formats if you have some basic software-development skills.
Q: We would like to bundle SIGVIEW with our device, is it possible to get a customized version?
A: Yes, many different customization options are available for OEM SIGVIEW versions. You can freely define and request the changes you need. We can offer various licencing options, from seat-based license purchase up to royalty-free licenses.
A: Yes, many different customization options are available for OEM SIGVIEW versions. You can freely define and request the changes you need. We can offer various licencing options, from seat-based license purchase up to royalty-free licenses.
Video Tutorials
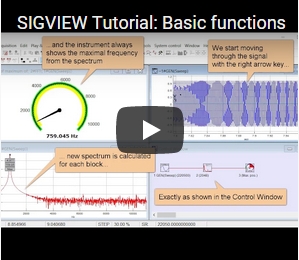
Tutorial: Basic functions (External YouTube link)
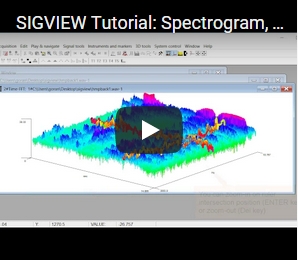
Tutorial: Spectrogram, Time-FFT (External YouTube link)
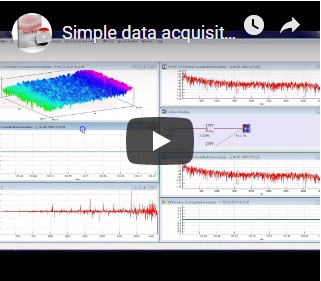
Tutorial: Data acquisition (External YouTube link)
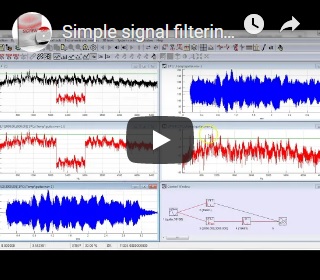
Tutorial: Filtering (External YouTube link)
Tutorial: Julia Language scripting (External YouTube link)