Extracting Signals (Slices) from 3D Graphics
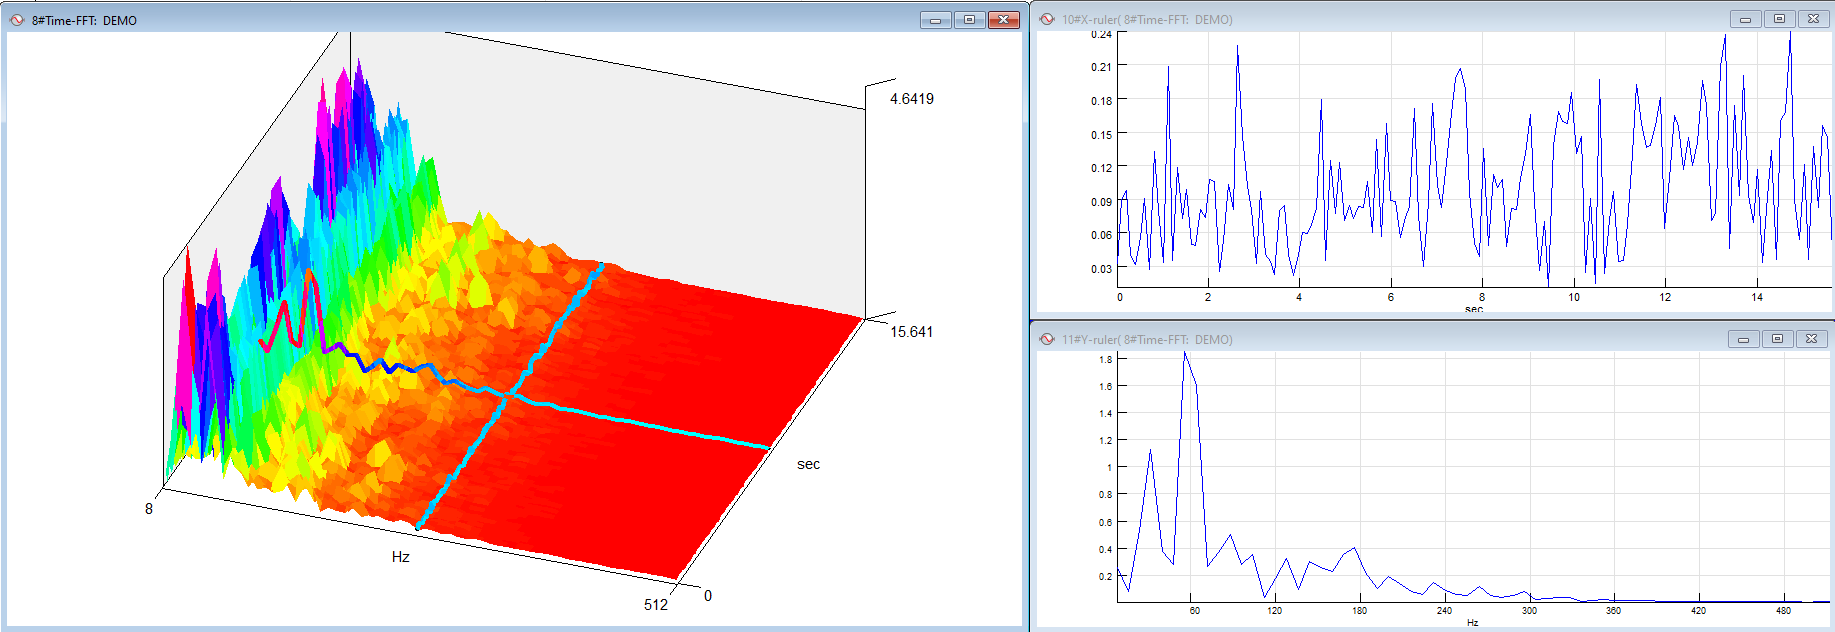
It is often very useful to view extracted slices from 3D graphics as signals. For example, you can extract all values at the same frequency from Time FFT to see how that frequency component changes through time.
You can perform this in SIGVIEW by selecting the “3D Tools/Extract X(Y) cursor” option from the menu (3D graphic must be in a cursor mode). All values from the current cursor position will be extracted to a separate signal window linked to this 3D graphic. By moving the 3D cursor along the 3D graphic, this signal will redraw to show the current cursor values. Even if you turn the cursor mode off, the extracted signal will keep showing the corresponding values from the 3D graphic (from the last cursor position).